Start 30 days free, no card. Full Pro access for a month, then decide. Start free
How to read Tellvest Earnings Pulse
You follow U.S. public companies and want a single, shareable read of how corporate America sounded on this quarter's earnings calls. Not one ticker. The market-wide snapshot.
On Tellvest, that snapshot is Earnings Pulse. This page shows you what Pulse is, when to open it instead of Economy, how to land on the latest or a prior quarter, and how to read the score, sectors, movers, and macro themes.
Strong disclaimer: Tellvest is descriptive analysis for research and informational purposes only. It is not investment advice. Past performance does not predict future results. Numbers on Pulse move as more calls are analyzed. Confirm the live page before you cite them elsewhere.
What Earnings Pulse is
From About: Earnings Pulse distills each quarter into a single market-wide read. Economy-wide sentiment and how it shifted. The most and least optimistic sectors. The biggest sentiment movers. The macro themes gaining and losing attention. Every past quarter keeps its own permanent page.
The headline is a 1-10 economy-wide earnings-call sentiment score. A score of 10 is most positive. The reading is built from what management and analysts said on the quarter's earnings calls.
Pulse is the handoff you can share: one finished (or in-progress) quarter, sectors, movers, and themes in one place. It sits next to the company 1-10 score path (How to get a 1-10 sentiment score) and the broader product overview (Earnings-call intelligence).
Pulse vs Economy (ESI): when to open which
Same research family. Different job.
| Open this | When you want |
|---|---|
| Economy (Economic Sentiment Index) | The living dashboard: ESI composite, macro signal heatmap, Macro Backdrop (FRED), "What the Fed is saying," quarter selector, sector views |
| Earnings Pulse | The shareable quarterly snapshot: economy-wide score for that quarter, optimistic / least optimistic sectors, movers, themes gaining or losing attention, permanent past-quarter URLs |
Use Economy when you are working the interactive ESI workflow. Use Pulse when you want the finished-quarter (or early-season) handoff you can link or screenshot. For the step-by-step ESI walkthrough, see How to read Tellvest's Economic Sentiment Index.
How to open the latest and prior-quarter Pulse pages
- Open Earnings Pulse for the default Pulse page.
- Read the quarter label in the title (for example, "Earnings Pulse - Q2 2026"). The default
/pulseURL is not always the newest calendar quarter in progress. It often shows the last finished quarter while the next season is still early. - For a specific quarter, use that quarter's permanent URL. Example: Q3 2026 Pulse lives at
/pulse/2026-q3. - Use the Past quarters links on the Pulse page to jump to Q2 2026, Q1 2026, and earlier permanent pages.
- Re-check the live page before you cite a number. Company counts and scores update as more calls land.
Permanent quarter URLs vs the <code>/pulse</code> default:
- /pulse/2026-q3 shows Q3 2026 (early season).
- /pulse still defaults to finished Q2 2026.
Bookmark the permanent path when you mean a specific quarter. Do not assume /pulse equals "whatever quarter I am thinking about."
How to read the snapshot (score, sectors, movers, macro themes)
Work top to bottom on a Pulse page.
- Headline score and company count. Read the economy-wide 1-10 score, the company count ("across N U.S. public companies"), and the change vs the prior quarter. A score of 10 is most positive. Note the N. An early-season Pulse with dozens of companies that have reported is not the same sample as a finished quarter with hundreds.
- Most / least optimistic sectors. Each line is sector score /10 and (company count in that sector on this Pulse). Compare scores and sample sizes together. A high score on a thin count is a thinner read than the same score on a wide count.
- Sectors moving most vs last quarter. Pulse labels these as same-panel shifts (companies that reported in both quarters), so a move is not only a different mix of reporters. Read improving most and declining most with the prior and current scores and the delta.
- Largest gains / largest declines. Individual company movers with prior and current score and delta. Treat these as illustrative names on this sample, not a buy or sell list.
- What management teams are flagging. Macro themes with mention counts and improving vs deteriorating characterizations.
- Themes gaining and losing attention. Quarter-over-quarter change in how many companies flagged each theme (same-panel).
- Analysts who pushed hardest (when present). Highest share of questions scored as challenging (with a minimum question count). Research context, not a ranking of "best" analysts.
Always pair the score with the company count and the quarter label. Then open a company page when one name matters more than the market snapshot (How to browse earnings-call scores without Pro).

Worked example: Q3 2026 Pulse (live facts; early-season sample)
Live facts from Q3 2026 Earnings Pulse. This is an early-season sample (57 companies), not a finished full-quarter book.
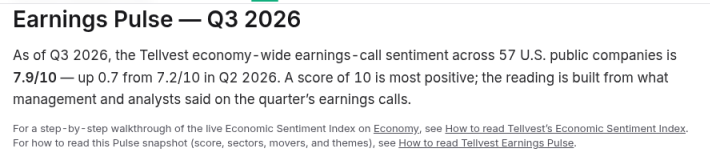
As of Q3 2026, the Tellvest economy-wide earnings-call sentiment across 57 U.S. public companies is 7.9/10, up 0.7 from 7.2/10 in Q2 2026. A score of 10 is most positive; the reading is built from what management and analysts said on the quarter's earnings calls.
Most optimistic sectors (Q3 2026, live):
| Sector | Score | Companies on this Pulse |
|---|---|---|
| Technology | 9/10 | 29 |
| Healthcare | 7.5/10 | 4 |
| Consumer Defensive | 6.8/10 | 9 |
Least optimistic (Q3 2026, live): Consumer Cyclical 6.1/10 (13).
Sector shifts vs last quarter (same-panel, live):
- Improving most: Consumer Defensive 6.1 to 6.8 (+0.7); Technology 8.9 to 9 (+0.1)
- Declining most: Consumer Cyclical 6.5 to 6.1 (−0.4); Healthcare 7.8 to 7.5 (−0.2)
Largest gains (live on page): HP Inc. (HPQ) 6 to 9 (+3); Campbell Soup Company (CPB) 1 to 4 (+3); Best Buy (BBY) 6 to 9 (+3); Walmart Inc. (WMT) 6 to 8 (+2); Synopsys (SNPS) 7 to 9 (+2).
Largest declines (live on page): GameStop Corp. (GME) 8 to 5 (−3); Credo Technology Group Holding Ltd (CRDO) 10 to 8 (−2).
Macro themes management flagged most (live): AI & technology (29 mentions; 29 improving, 0 deteriorating); Capital expenditure (19; 18 improving); Consumer spending (19; 1 improving, 9 deteriorating); Enterprise spending (19; 15 improving); Inflation (18; 0 improving, 12 deteriorating); Supply chain (18; 1 improving, 12 deteriorating).
Themes gaining attention (live): Capital expenditure 11 to 19 (+8); Supply chain 16 to 18 (+2). Losing attention (live): Trade & tariffs 21 to 16 (−5); Enterprise spending 22 to 19 (−3).
Contrast with the <code>/pulse</code> default (finished Q2): /pulse still shows Q2 2026 at 7.2/10 across 579 U.S. public companies (up 0.2 from 7/10 in Q1 2026). That finished-quarter 579 book is not the same sample as early Q3's 57. Do not present them as equal coverage of "the market."
Confirm both live URLs before you reuse these figures. They will move as more Q3 calls are analyzed.
Free vs Pro
- Free: Prior quarters for every company and for economy, sector, industry, and Mentions views. Company list with sentiment scores and trends. Analyst and firm tracker. Pulse permanent pages for past quarters are part of that shareable free market-wide read. No account needed to browse the free layer.
- Tellvest Pro ($12/month): The newest quarter everywhere the moment it is analyzed (companies, economy, sectors, industries, Mentions), plus pre-earnings briefs, macro signal and theme screener, returns analysis and trade signal history, watchlist email alerts, and coverage requests. Cancel anytime.
- Trial: Every new account starts with 30 days of full Pro, free. No credit card required. When it ends, keep Pro for $12/month or stay on the free tier.
Practical split: use Pulse and prior-quarter company scores on the free layer when you want the snapshot and history. Use Pro when you need the newest quarter on Economy and company pages as earnings season unfolds. For the free company-score path, see How to browse earnings-call scores without Pro. Pricing detail: Pricing.
FAQ
What is Earnings Pulse?
Earnings Pulse is Tellvest's shareable quarterly snapshot of economy-wide earnings-call sentiment. From About: it covers the market-wide score and shift, most and least optimistic sectors, biggest movers, and macro themes gaining or losing attention, with a permanent page per past quarter. Open Pulse or a permanent path such as Q3 2026.
How is Pulse different from ESI on Economy?
Economy is the living ESI dashboard (composite score, heatmap, FRED Macro Backdrop, Fed summary, quarter selector). Pulse is the single-quarter handoff you can share. Same sentiment family; different surface. Full ESI walkthrough: How to read Tellvest's Economic Sentiment Index.
How do I open the latest Pulse vs a past quarter?
Use the permanent quarter URL when you mean a specific quarter (example: /pulse/2026-q3). The default /pulse may still show the last finished quarter. /pulse still shows finished Q2 2026; /pulse/2026-q3 shows early Q3 2026. Use Past quarters links on the page to move between permanent URLs.
Why do company counts differ (57 vs 579)?
Because the sample size is the number of U.S. public companies analyzed for that Pulse page at that moment. Live check 2026-09-22: early Q3 2026 is 57 companies; finished Q2 on <code>/pulse</code> is 579. Early-season Q3 is not equal coverage to a finished Q2 book. Cite the quarter label and the N together. Do not mix them as if they were the same panel.
What is free vs Pro for Pulse and related views?
Prior quarters (companies, economy, sectors, industries, Mentions) stay free. Pulse permanent past-quarter pages are part of the free shareable snapshot. Tellvest Pro unlocks the newest quarter everywhere as season unfolds, plus forward tools listed on Pricing. Trial: 30 days of full Pro free, no credit card required.
Is this investment advice?
No. Tellvest provides descriptive analysis for research and informational purposes only and is not investment advice. Past performance does not predict future results. See About.
Takeaway
To read Tellvest Earnings Pulse: open the permanent quarter URL you mean (Q3 2026 for early season; default Pulse may still be finished Q2), read the 1-10 score with the company count (Q3 early 7.9/10 across 57, up 0.7 from 7.2; /pulse Q2 7.2/10 across 579), then scan sectors, same-panel shifts, movers, and macro themes. Early-season N is not finished-quarter N. Use Economy for the interactive ESI; use Pulse for the shareable snapshot. Not investment advice.
See the Economic Sentiment Index
How to read Tellvest's Economic Sentiment Index
How to read Tellvest industry earnings-call sentiment
How to browse earnings-call scores without Pro